


MARKET DEMAND
CUSTOMER
VALUES
SUPPLY OFFERING
VALUE PROPOSITION
POSSIBILITY
POTENTIAL
OPPORTUNITY
PURCHASE
CONVERSION
PROMOTION
DEVELOPMENT
ANALYSIS

SECTOR
PRIORITIES

TRADE
AGREEMENTS

FINANCING &
INCENTIVES
TRADE AGREEMENTS

ECONOMIC POLICY
MRI
SCAN
BEST
MARKETS

FSI
MATRIX

EXPORTABLE OFFER
MARKET ACCESS

MARKET
MODE

BUSINESS PRACTICES


MATCH
MAKING
1. BEST MARKETS


MARKET DEMAND

BEST
MARKETS

SUPPLY OFFERING
The BEST MARKET SELECTION tool -BMS- is probably the best available tool for policy makers
to decide in which markets to invest. BMS uses a set of proven criteria and variables to define
in which markets there are POSSIBILITIES for export. Variables used are
1. Actual exports of the sector
2. Macroeconomic variables
a. Economical Classification -World Bank new country classification
b. Country Classification - Coface methodology
3. Growth of imports
a. Imports worldwide
b. Imports from the region
c. Imports from the country
4. Analysis of the competition
a. Participation of the exporting country vs competing countries
b. Market access - trade agreements, preferences, duties
These variables are the basis for performance indicators of the importing and
exporting country alike. Composed indicators yield a number of "best markets"
NATIONAL
TRADE POLICY
ARTICULATION
OF AMBITIONS
SECTORIAL
TRADE STRATEGIES


Onno Roukens of Globally Cool, member of the consortium that developed the BMS tool as part of ProColombia's new methodology:
"We are proud that ProColombia won ITC's TPO award with our program and that we could contribute to making it one of the best TPO's in the world"

CUSTOMER
VALUES

MRI
SCAN

VALUE PROPOSITION
2. MRI SCAN


MARKET DEMAND

BEST
MARKETS

SUPPLY OFFERING
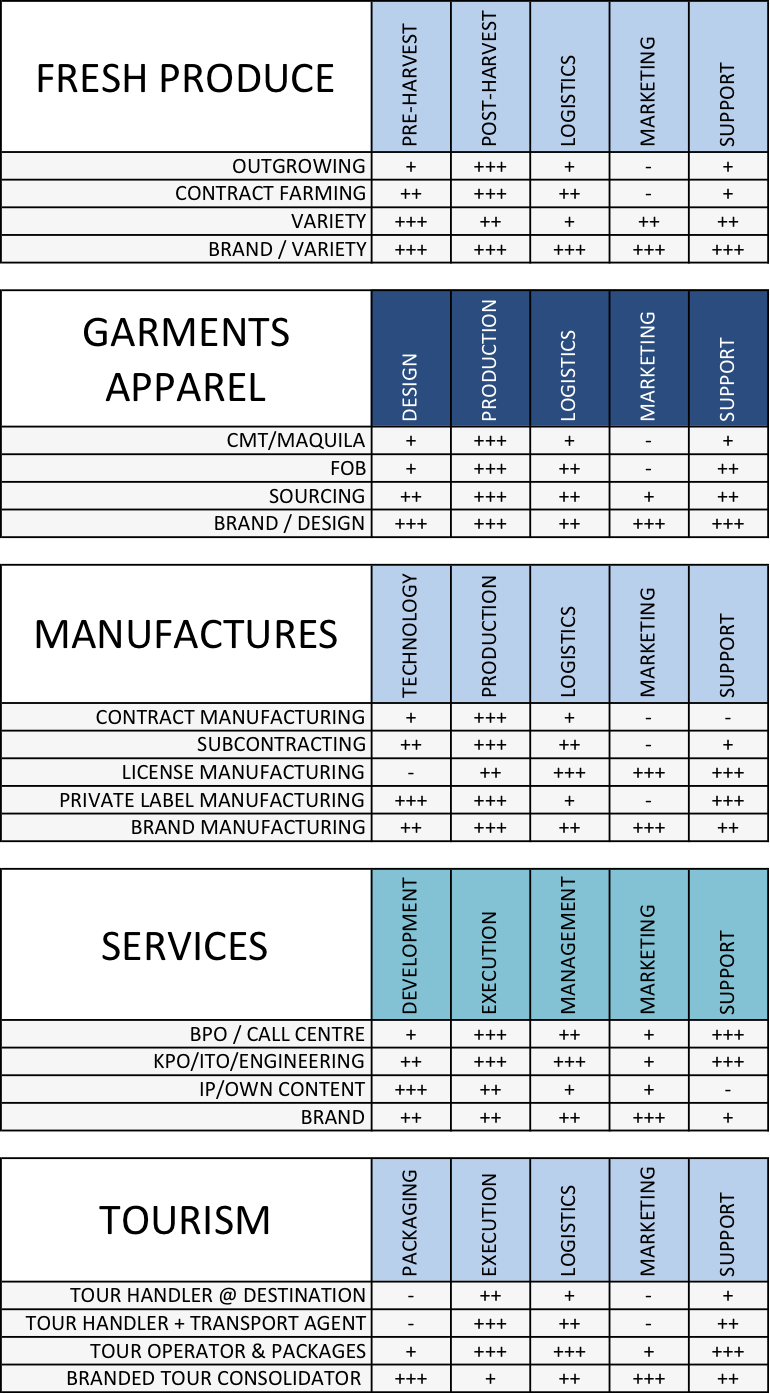
Our unique value chain analysis consists of three steps:
1. Value system identification -stakeholders relevant for the value proposition:
a. ACTORS - companies that are part of the supply chain
b. ENABLERS - support organizations, functional, sectorial and/or regional
c. DRIVERS - government, ministries and other public institutions
2. Stakeholder mapping - relevance and position (bubble graph) in the three value
creating domains:
a. R&D
b. PRODUCTION
c. MARKETING
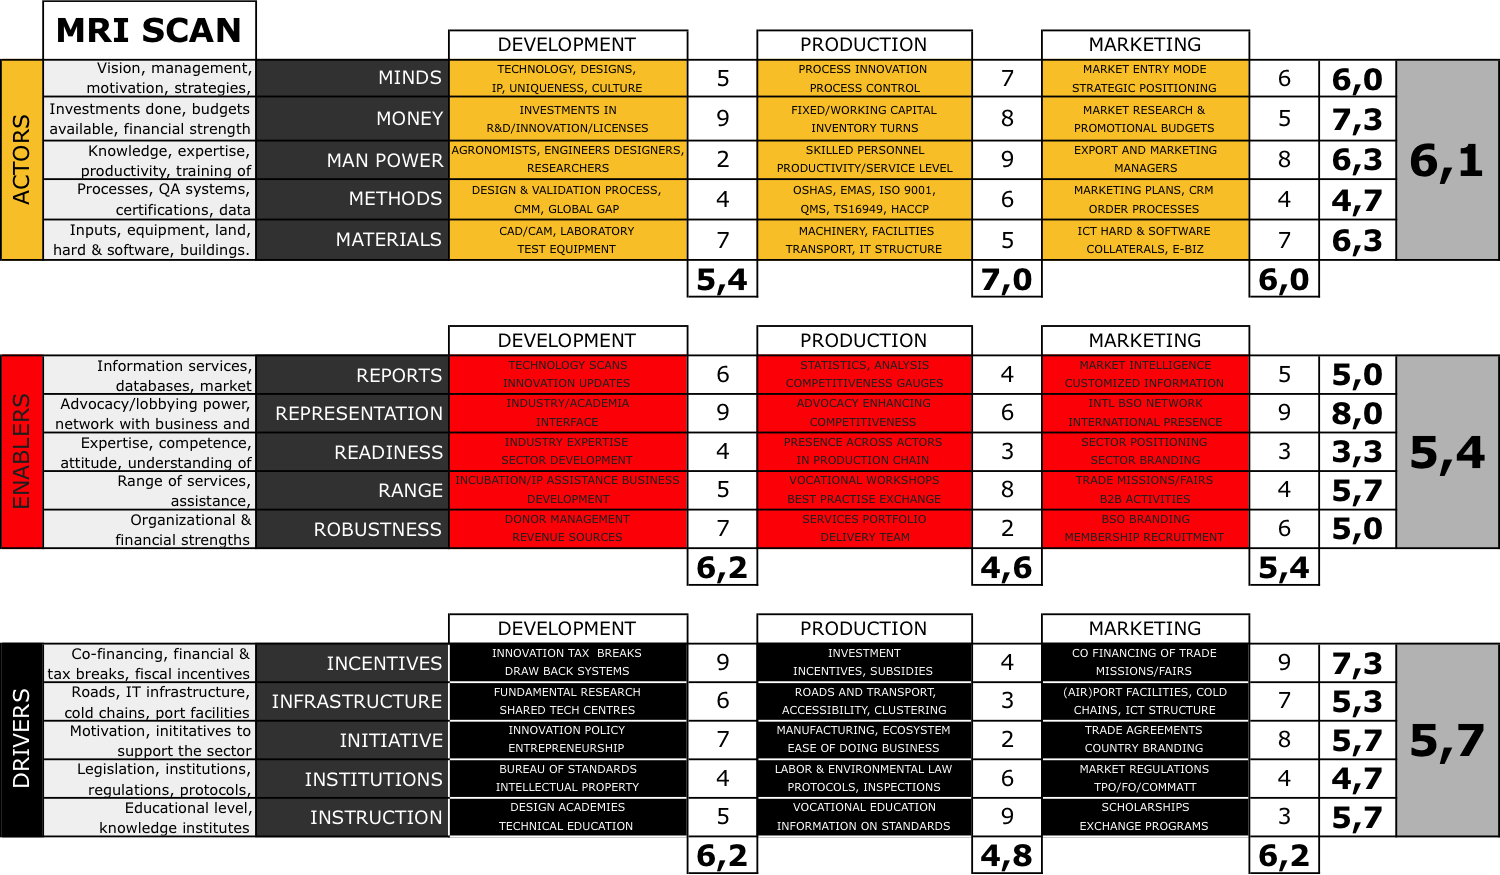
3. MRI Scan - the confrontation matrix that shows the competitiveness of a sector in
global markets, based on the performances of the three stakeholder groups.
Each of these groups are assessed on a number of criteria, relevant for the
competitiveness of the sector. The outcome is captured in the following formula:
where
C = competitiveness
x = score of actors
y = score of enablers
z = score of drivers
C = x3y2z1

TRADE


ACTOR DIVERSIFICATION
PRODUCT DIVERSIFICATION
MARKET DIVERSIFICATION


3. FSI MATRIX

ValueNomics

CUSTOMER
VALUES

MRI
SCAN

VALUE PROPOSITION

MARKET DEMAND

BEST
MARKETS

SUPPLY OFFERING

MARKET ACCESS
FSI
MATRIX
EXPORTABLE OFFER
The FSI matrix is a solution design tool for the constraints identified in the MRI scan. It puts :"first things first" to avoid that stakeholders start up uncoordinated actions that are counterproductive to competitiveness enhancement. Like the MRI scan, the FSI matrix is constructed during a strategic conference -as a self assessment, thius increasing the ownership of stakeholders for the outcome.
In the FSI matrix, the constraints are classified according to three criteria:
1. Feasibility - how easy will it be to lift a certain constraint
2. Speed - how likely is it that it can be done in a reasonable timespan
3. Impact - how important is this solution for generation of foreign currency
For each criterion, individual scores are given. The consolidated score is the basis for the sectorial trade strategy and its corresponding action plan

4. MARKET MODE


CUSTOMER
VALUES

MRI
SCAN

VALUE PROPOSITION

MARKET DEMAND

BEST
MARKETS

SUPPLY OFFERING

MARKET ACCESS
FSI
MATRIX
EXPORTABLE OFFER

MARKET
MODE
BUSINESS PRACTICES

MATCH
MAKING
The final step of the trade process is the choice of market mode. This choice is based on the low and high scores of the MRI scan, which are projected on each of the options in the market mode

THE PROCESS


MARKET DEMAND
CUSTOMER
VALUES
SUPPLY OFFERING
VALUE PROPOSITION
POSSIBILITY
POTENTIAL
OPPORTUNITY
PURCHASE
CONVERSION
PROMOTION
DEVELOPMENT
ANALYSIS
MRI
SCAN
BEST
MARKETS

FSI
MATRIX

EXPORTABLE OFFER
MARKET ACCESS

MARKET
MODE

BUSINESS PRACTICES


MATCH
MAKING

TRADE
1. BEST MARKETS
The best markets selection tool reveals the best POSSIBILITIES, theoretical
chances for trade on the basis of quantitative criteria.
2. MRI SCAN
The MRI scan, followed by trade development activities, create the POTENTIAL
for trade, a theoretical chance for trade on the basis of qualitative criteria
3. FSI MATRIX
The FSI matrix shows how to create an OPPORTUNITY, a situation where the
value proposition meets the customer values of target markets
4. MARKET MODE
The market mode converts the opportunities into business


Trade strategies that work
POSSIBILITY
POTENTIAL
OPPORTUNITY
CONVERSION